FINANCIAL OVERVIEWInformation on the consolidated financial and operating results of MTS Group for Q4 2020 and entire 2020 is available on the company’s website: Financial statements — Moscow (mts.ru).
I am pleased to announce that MTS finished the year perfectly well. Despite global challenges, we achieved record high financial results in Russia in 2020. Our core telecommunications business has shown strong growth in both wireless and wired segments. In our new verticals, we saw a sharp increase in the positive dynamics of KPIs. In the FinTech, MTS Bank’s net interest income grew by 32 % year-on-year. In the media vertical, an increase in new users of the OTT platform amounted to 1.5 million subscribers — this increase is greater than the total number of users of the service at the beginning of last year. In the corporate digital solutions market, we have increased the number of devices in MTS networks for the Internet of Things by 30 % and achieved a doubledigit growth in the cloud business revenue.
All in all, we went through the first year of our CLV 2.0 strategy implementation at a good pace and achieved our intended results. We will continue to gain momentum and move towards becoming a leading Russian provider of advanced digital services on the basis of our infrastructure.
Vyacheslav Nikolaev MTS’ President
| 2020 Forecast | 2020 Results | |
|---|---|---|
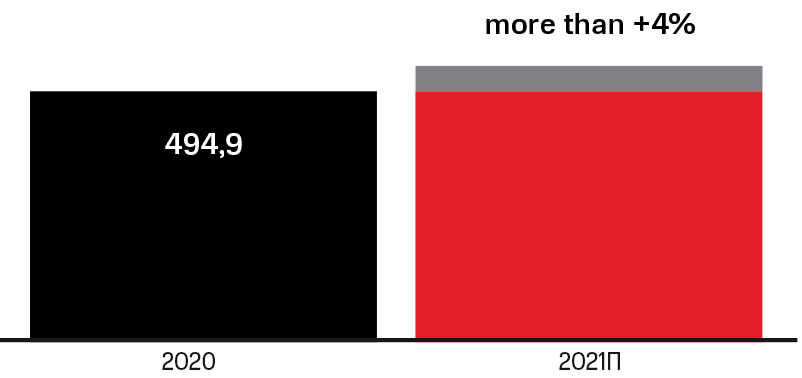
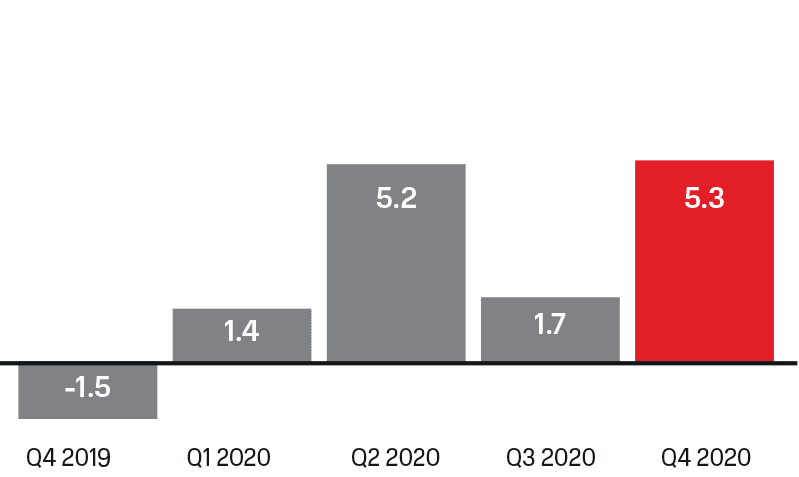
| Revenue | over +3% | +5.2% |
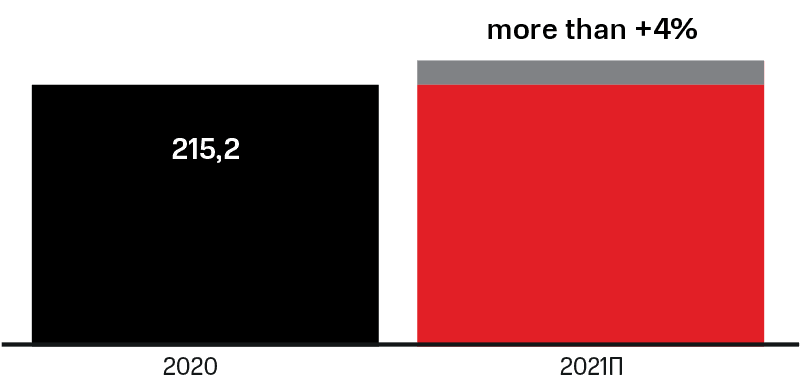
| OIBDA | up to +2% | +1.7% |
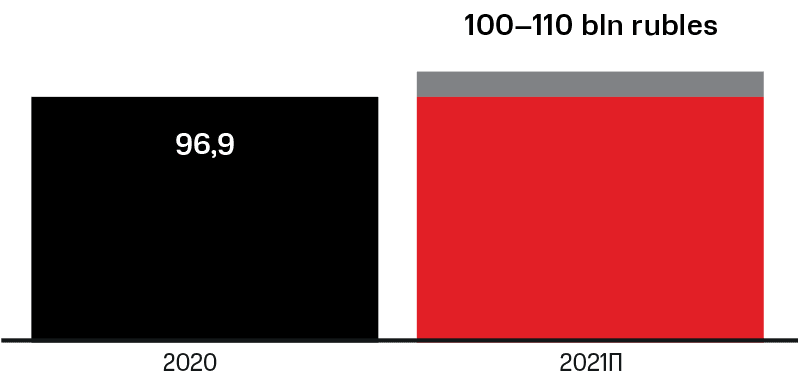
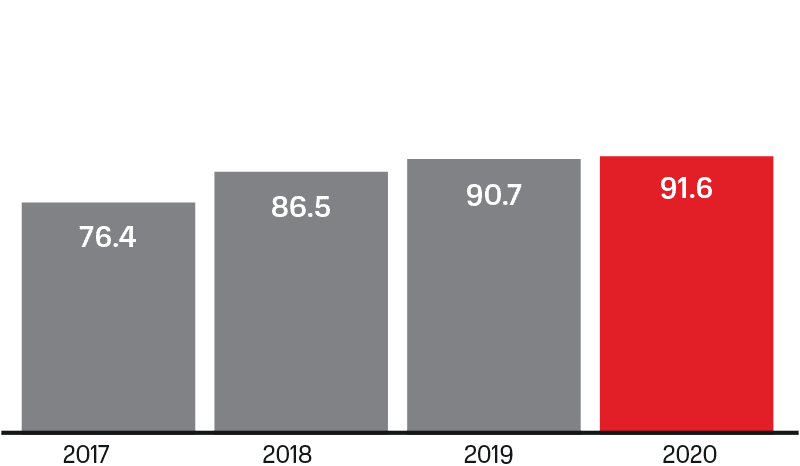
| CAPEX | about 90 billion rubles | 96.9 billion rubles (91.6 billion rubles, taking into account the effect of financial derivatives) |
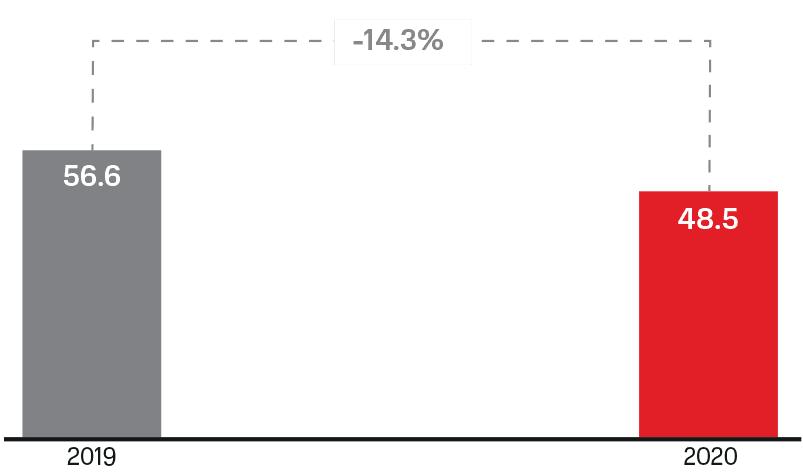
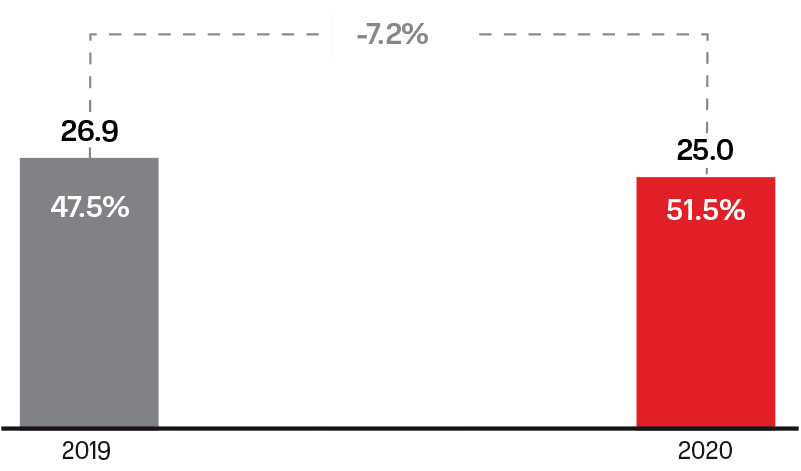
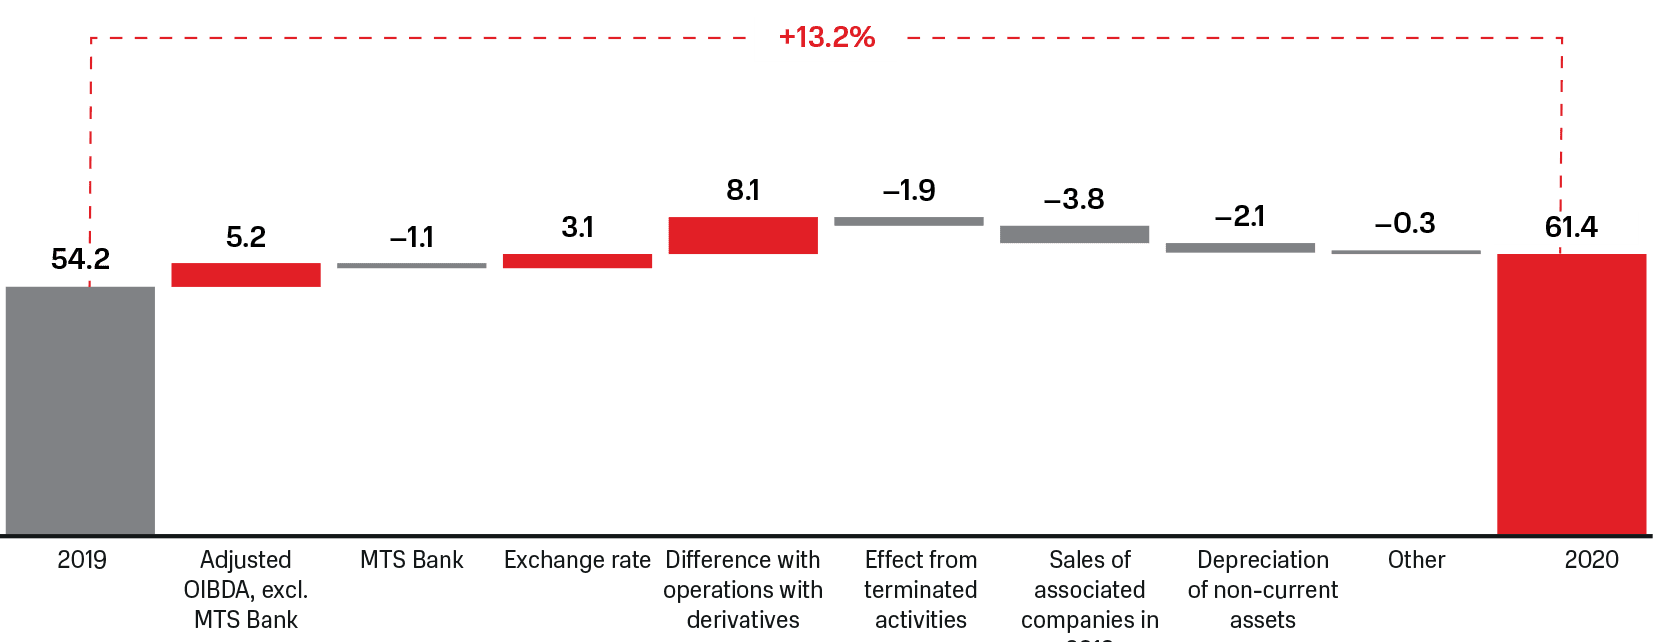
Adjusted OIBDA of the Group for 2020 increased by 1.7 % versus the same period of the last year — to 215.2 billion rubles. The growth was driven by high revenues from the basic services, which were at the same time constrained by negative factors, including lower consumption of highmargin international roaming services amid the COVID-19 pandemic; reserves in MTS and MTS Bank; one-time effect due to real estate transactions in Q1 2019.Andrey Kamensky MTS Management Board Member,
Vice President for Finance
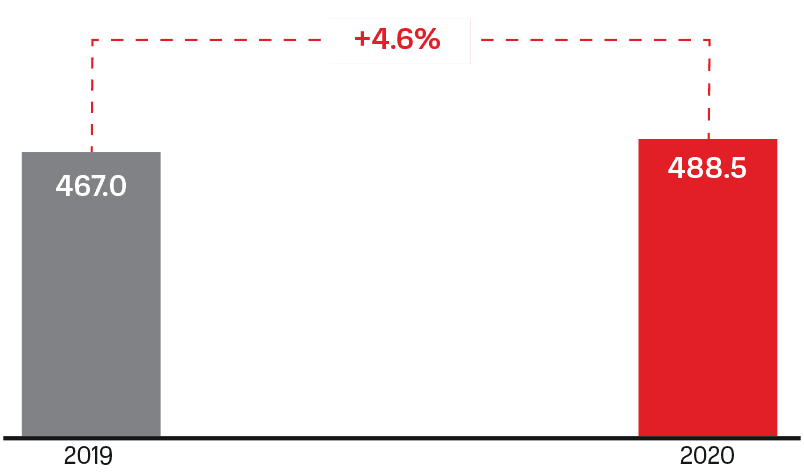
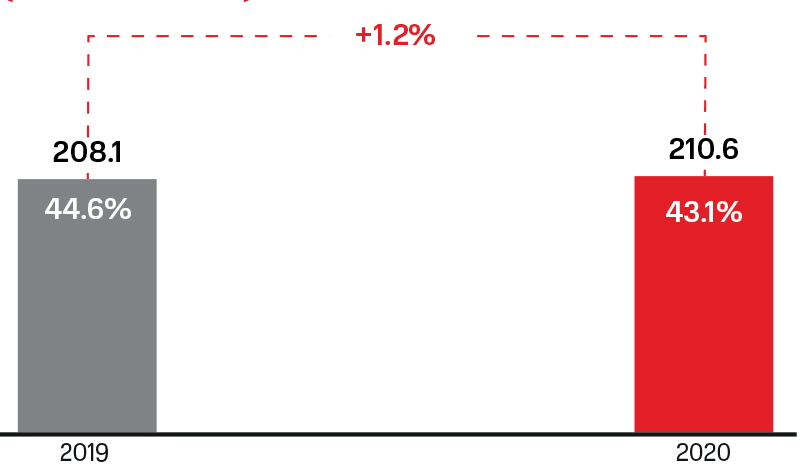
MTS Group’s revenue for 2020 increased by 5.2 percent vs 2019 to 494.9 billion rubles. Annual dynamics of the MTS Group’s revenue is due to both the dynamics of consumption of basic telecommunications services and the development of new business segments, with media and FinTech areas, as well as cloud and digital solutions for the business market providing almost a third of the annual revenue growth.Andrey Kamensky MTS Management Board Member,
Vice President for Finance
growth of the core business and new areas
Positive results of MTS Group in 2020 due to:
- Growth of mobile revenue in Russia related to the growth of traffic and communication services consumption
- Growth in consumption of FinTech and media products, services of MTS Bank, cloud and digital solutions for corporate clients
Sustainability
- Growth in OIBDA of the Group due to stable increase of income from basic services
- OIBDA of the Group was impacted by: a decrease in revenues from international roaming amid the COVID-19 pandemic, the effect of MTS Bank and the effect of a high base in Q1 2019 resulting from one-time real estate transactions
Income growth and subscriber base recoveryRussian.
Fintech
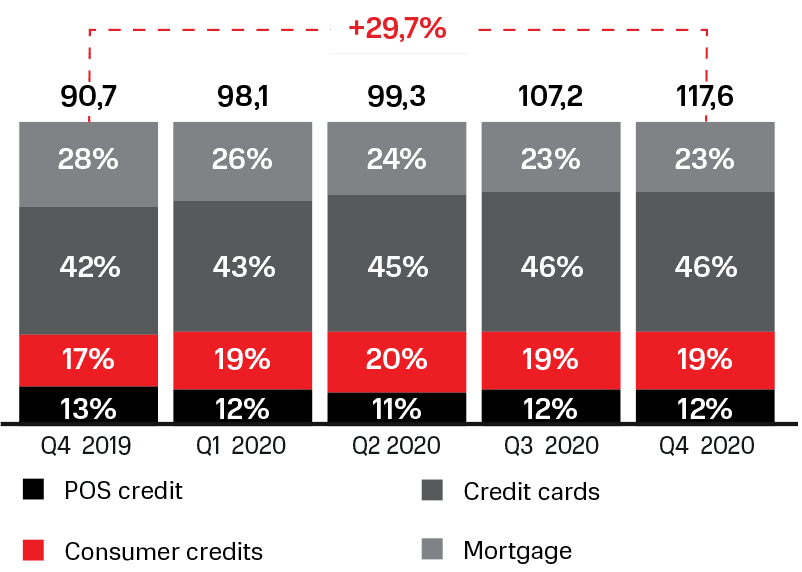
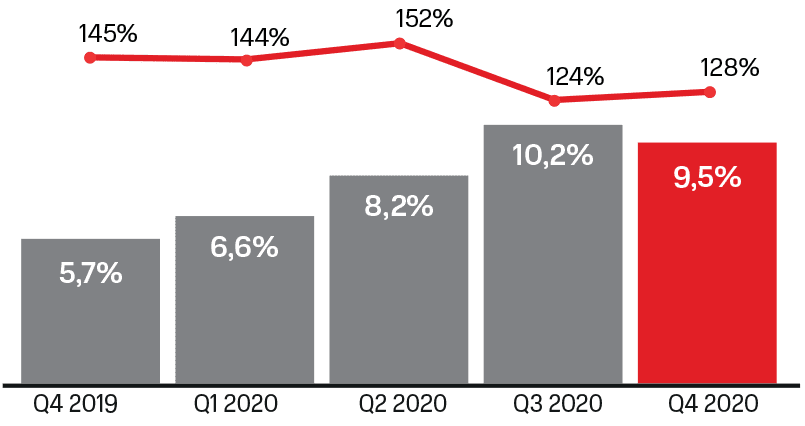
MTS Bank, key indicators
- MTS Bank entered TOP 5 for its growth rates of the retail credit portfolio, top 10 for the amount of the credit card portfolio, top 10 of the best mobile banks for daily tasksThe source is Frank RG, data by MTS Bank.
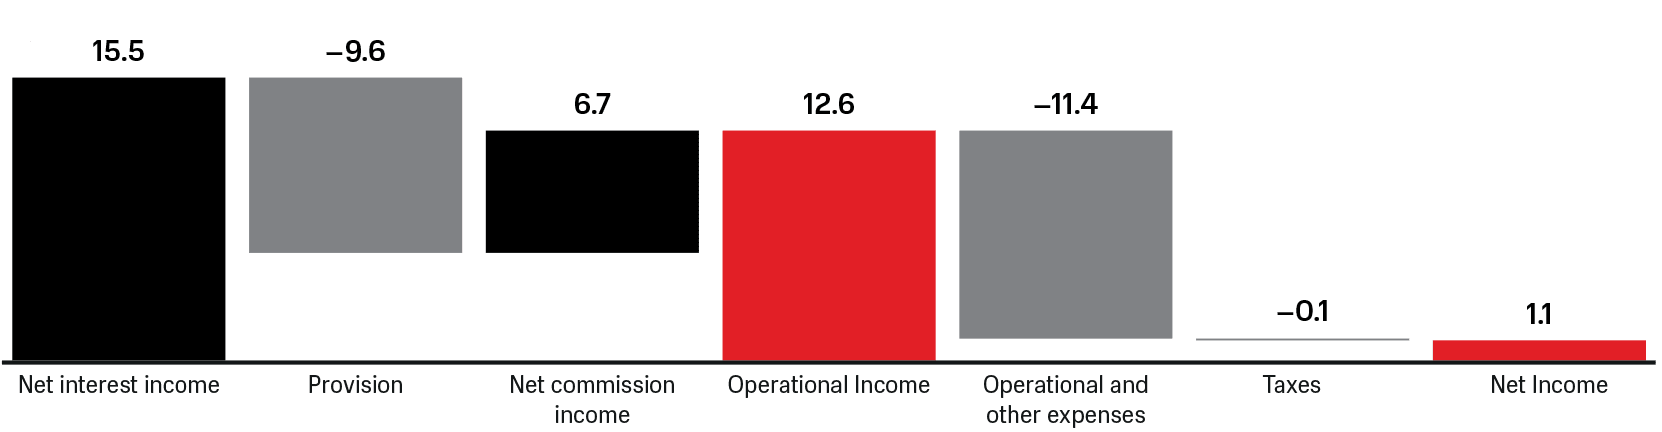
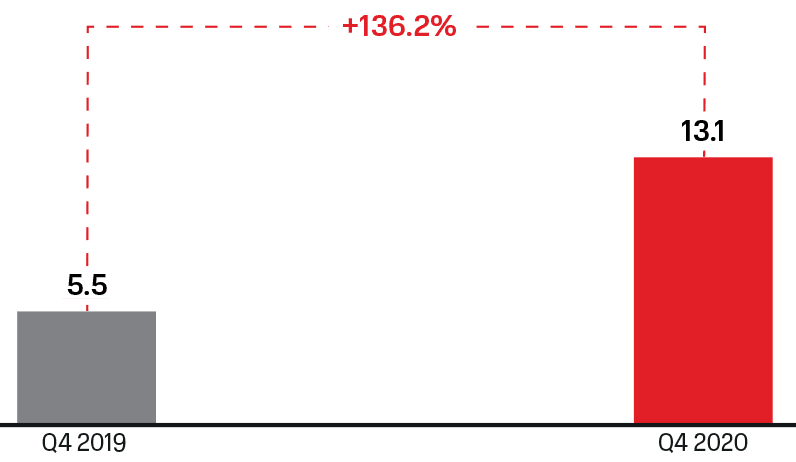
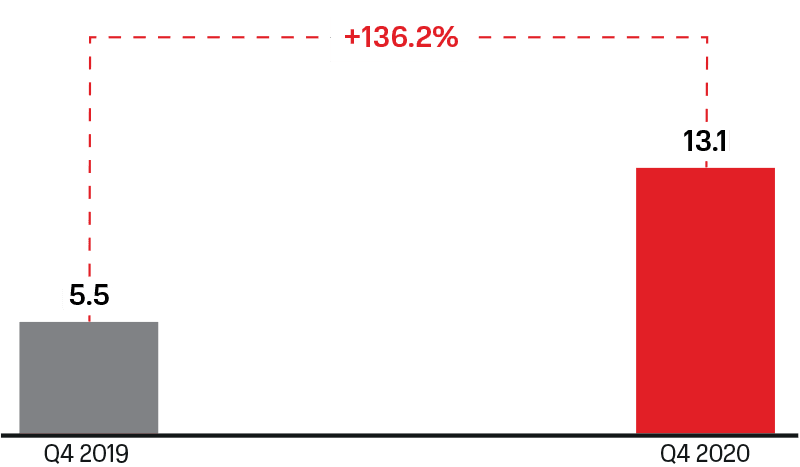
MTS Bank: positive net profit
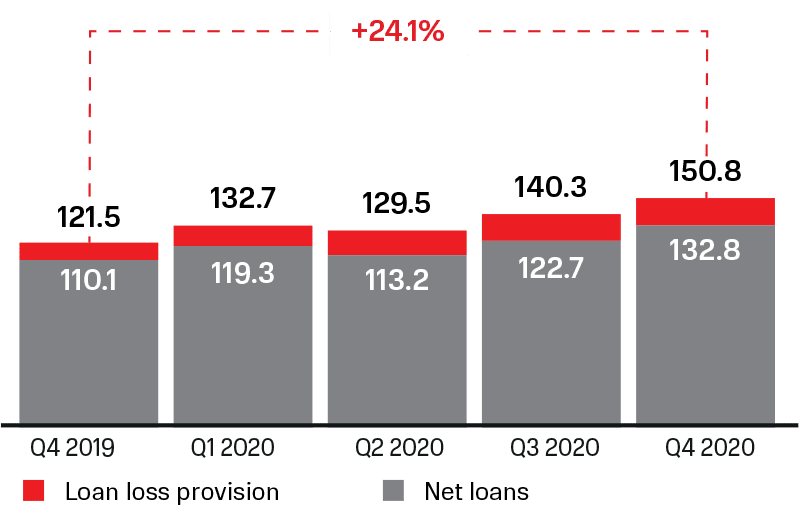
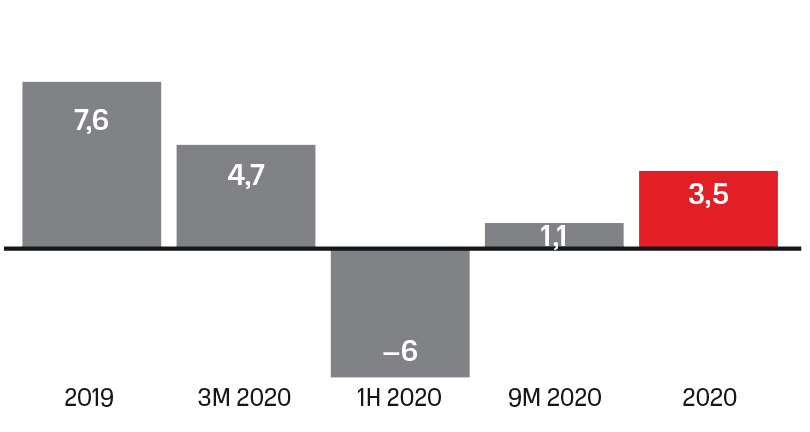
- Notwithstanding significant negative consequences of the pandemiс for the whole bank sector MTS Bank completed the year with a growth in the credit portfolio and positive financial result
MTS Bank NPL decreased, COR stable
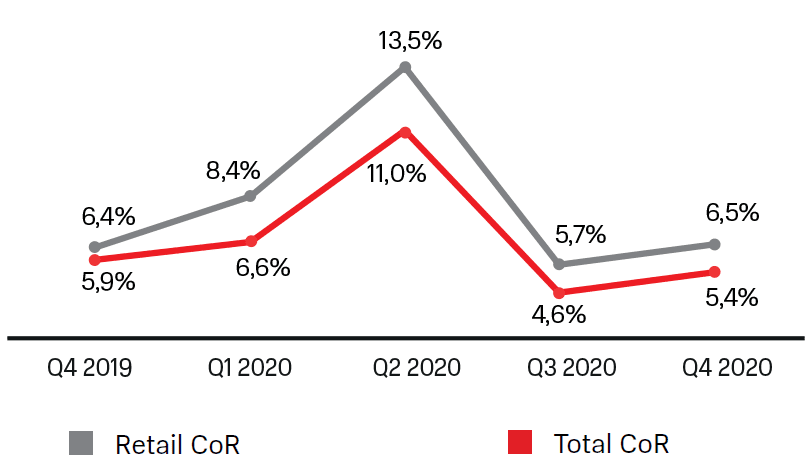
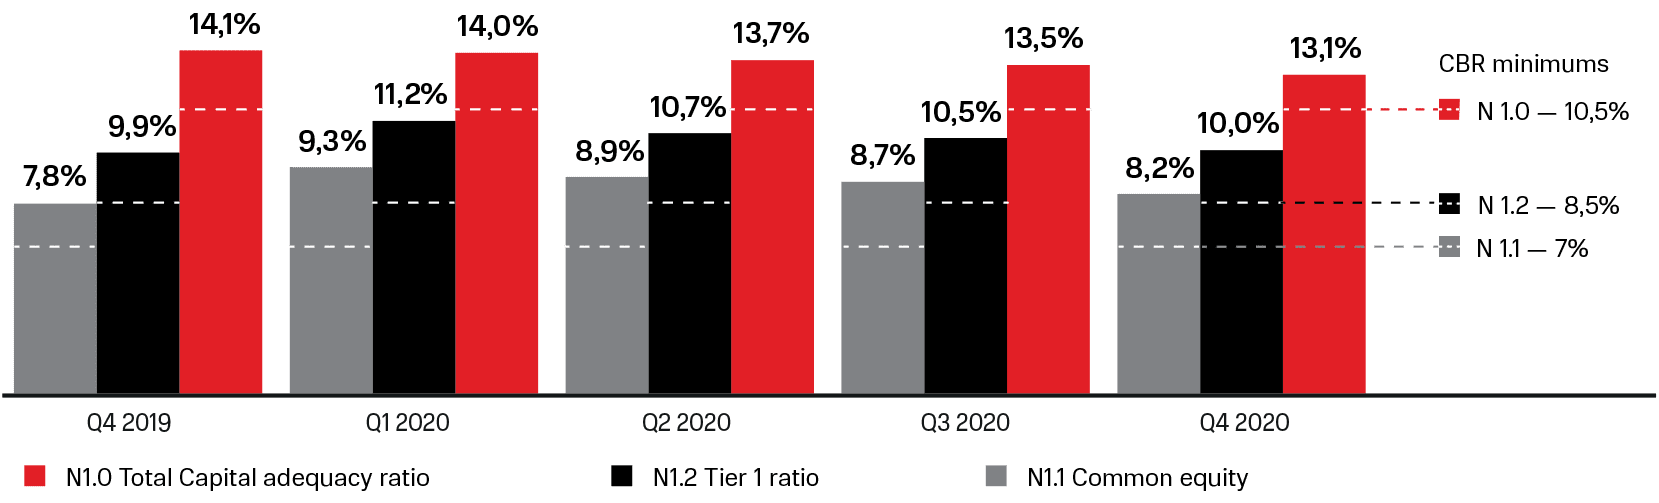
- The bank maintains a comfortable capital stock in excess of the standards, taking into account regulatory surcharges. Risk is assessed as low
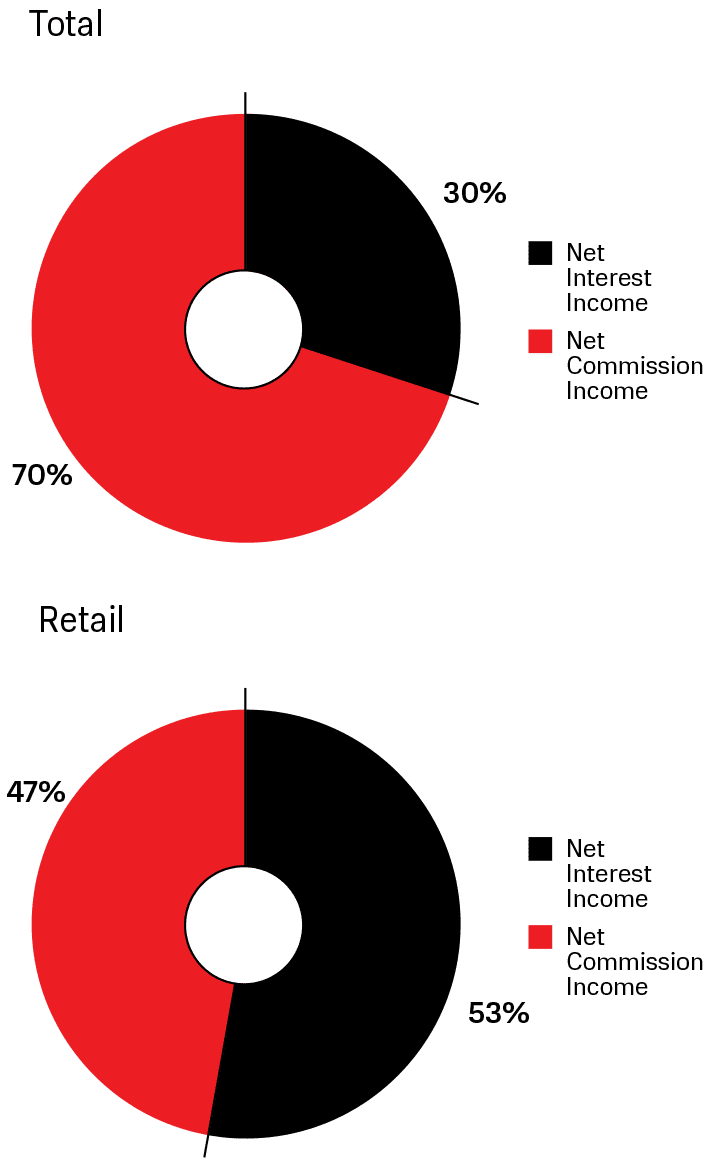
Stability of the main business
The growth of the net profit was due to stable indicators of the main business and an increase in net interest expenses, which reflects current MTS’ steps for optimization of the debt portfolio as well as effect from changes in exchange rates and operations with derivative instruments regularly used by the company to decrease volatility
The negative impact on the net profit was made by results from terminated activiities, transaction of MTS Bank, and depreciation of assets in sales of tickets and entertainment
Development of infrastructure and new areas
In 2020 MTS Group constructed 16.3 thousand stations in 78 regions of Russia including 14.5 4G stations
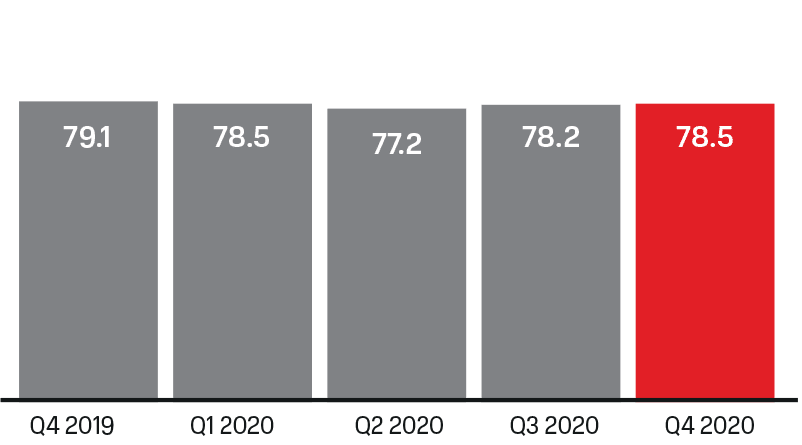
For the entire 2020 consumption of mobile Internet at smartphones in MTS network increased by 38.6% vs. 2009, and penetration of smartphones in the MTS network was 78.1% vs. 74.5% late 2020 in the fourth quarter of 2019
| 2020 | 2019 | |||
|---|---|---|---|---|
| Capital expenditures of the Group, bln rubles | In % of the revenues | Capital expenditures of the Group, bln rubles | In % of revenues | |
| | 95.0 | n/a | 81.0 | n/a |
| | 1.9 | 26.0% | 1.5 | 19.7% |
| | 96.9 | n/s | 90.7 | n/s |
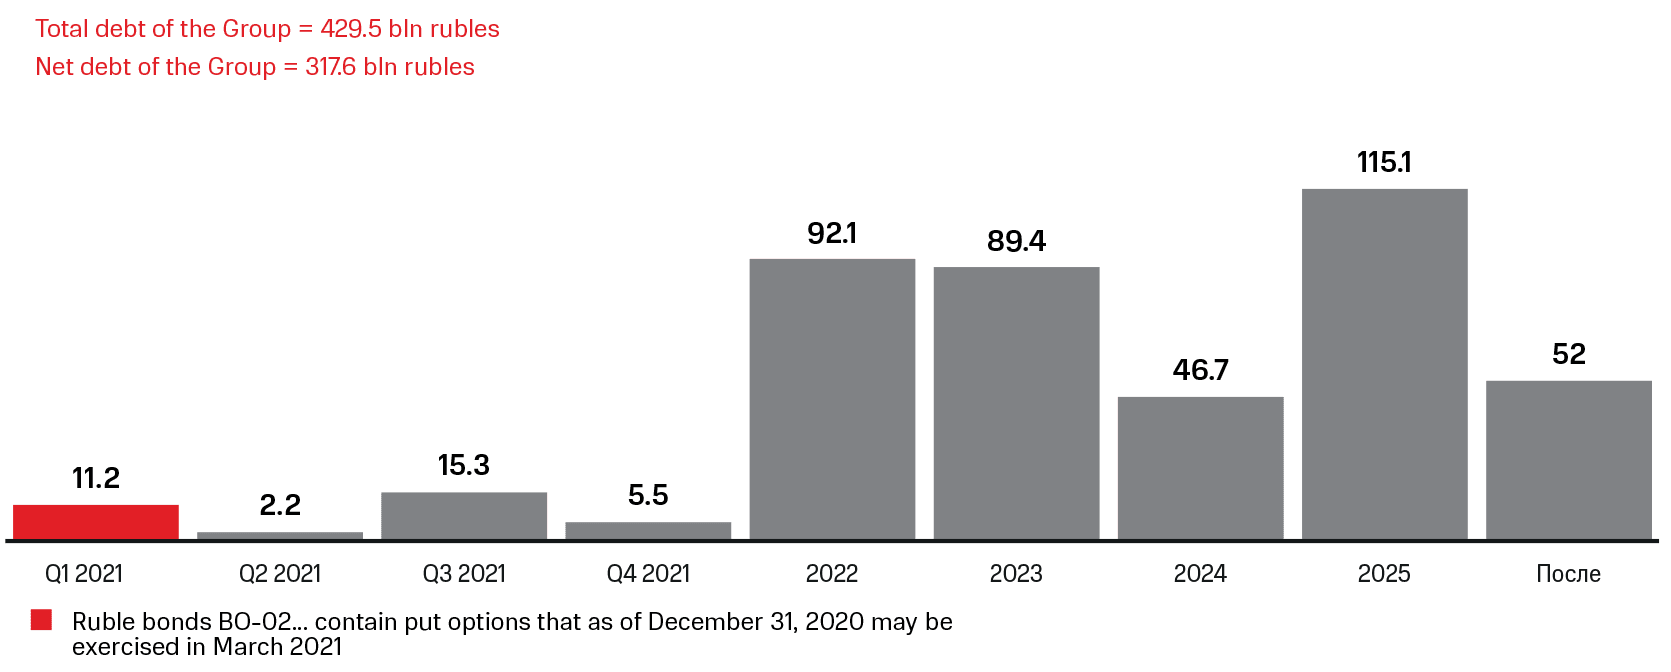
Financial stability and decrease in the debt value
BO-02 Ruble bonds contains put options which can be executed in March 2021 as of December 31, 2020
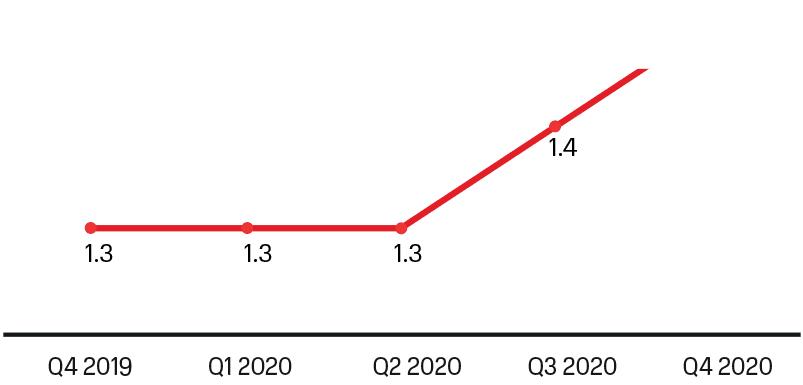
Relation of the net debt to LTM of adjusted OIBDA remains at the 1.5x comfort level which allows to retain financial stability and the ability of the company to support both the volume of investment and high profitability for shareholders
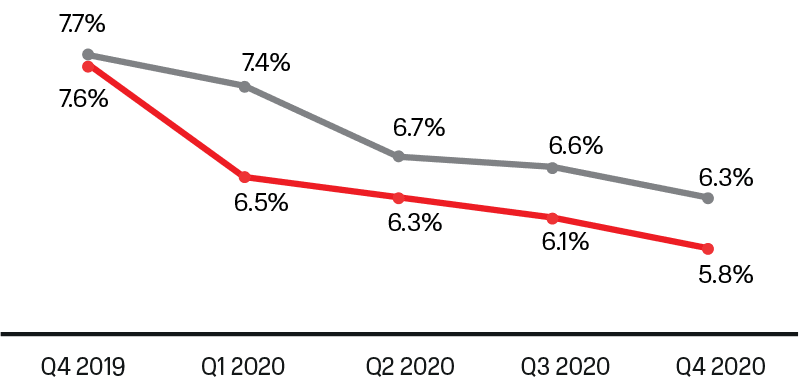
In the 4th quarter of 2020 MTS decreased the average weighted interest rates of the total debt from 7.7% to 6.3% in the 4th quarter of 2029 thankful to optimization of the debt portfolio.
Forecast for 2021